| Hey What's That? Mapplet Frequently Asked Questions |
| Home General FAQ and Site Map |
This is the Mapplet FAQ for HeyWhatsThat.com. Be sure to visit the main site, whose mission is to tell you the names of the mountains you can see when you're standing almost anywhere in the world, and the general FAQ, which lists all the features that HeyWhatsThat has to offer. And please sign up for our occasional email announcements.
What happened to Mapplets?
Mapplets are based on the old version 2.0 of the Google Maps API, and when Google deprecated that API in May 2010, mapplets followed the API into the "they'll be around for a few more years but no new development" bucket. In December 2010 they disappeared from Google Maps MyMaps; the links below still worked for a while, but you could no longer overlay multiple mapplets on the same map, and settings were not saved between sessions. As you now read this, they're completely gone.As an alternative to the Contours and Profiler mapplets, you can browse to the Path Profiler for similar functionality.
What's a Mapplet?
Mapplets, also known as Mashups 2.0, is a Google technology "which enables any developer to create mini applications that overlay their content and services onto Google Maps." That quote, and more info, is available here, and there's a getting started video too.Google asks you to suppose you're looking for a new home. You go to maps.google.com and open the mapplet that lets you search for real estate listings. To delve further into a neighborhood, you add mapplets that show school statistics or crime statistics or subway stops or photos of the area.
Now, with our sea level rise mapplet, you can ask the long-term question: "Will the neighborhood be dry in a hundred years?"
What have you got?
|
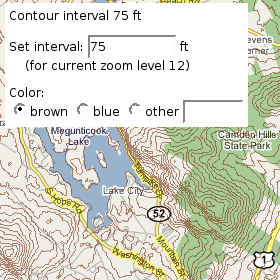
| The Elevation Contours mapplet allows you to add contours to any map you're viewing. It's similar to the Contours button on the main site and the Path Profiler, but here you can also specify the contour interval and color. |
|
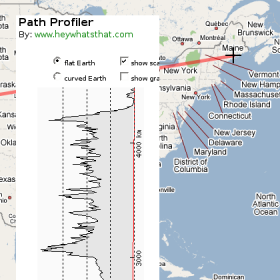
| With the Path Profiler mapplet you can draw an arbitrary path and see the elevation profile along that path. It's pretty much identical to the Path Profiler web page, except that the profile is rotated 90° to fit the mapplet layout. You can click the Popup button to open a copy of the profile and the list of points in its own window. Turn on the follow roads checkbox, and subsequent points will be added to the path using Google directions (similar to the Smooth route button on the Path Profiler web page, except here we don't break the route up into all the little pieces). |
|
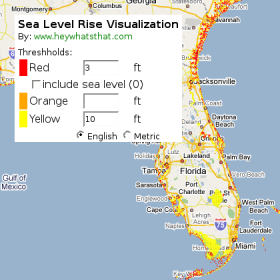
| The Sea Level Rise visualization shows you areas that would be underwater under arbitrary levels of sea level rise. See below for caveats. |
Why isn't it working with my browser?
We develop and debug the mapplets with Firefox, so the layout might be incorrect and some features may not work if you're using a different browser. Based on bug reports, it appears that the mapplets run reasonably well under Internet Explorer 7, but not under Safari.How accurate is the Sea Level Rise visualization?
This mapplet suffers from several shortcomings. First, the elevation data we use -- from the Shuttle Radar Topography Mission, further described in our general faq -- is not well suited for this application:These issues are discussed in detail in a series of posts at Free Geography Tools (1 2 3 4 5 6 7).
Does anyone else provide similar functionality?
We've come across several sites that are similar to the Path Profiler, including a mapplet, and we've listed them all in our general FAQ. For sea level analysis, there's the Flood Maps web page and the series of posts at Free Geography Tools listed above, which include an impressive series of more accurate renderings, including flooded buildings. You can see real nice looking elevation contours at EarthTools.How do I contact you?